3CX Call Reports
Customer satisfaction and agent productivity are top priorities when you are running a call center. 3CX professional and enterprise-level come with more than 20 reports to help your clients keep these priorities on track. Reports are easily available when you want, or you can schedule them as per your customer’s needs.
Most of the Reports can be Either:
- Exported as a CSV or HTML file
- Scheduled monthly, weekly, or biweekly
- Filtered like they can be pulled from call logs that are even a month old.
Let’s discuss the purpose of each report and the parameters that’ll help you know more about the benefits:
Part 1: Agent Performance Reports
1. User Activity: This ‘User Activity Graph’ helps to show the progress and activity or the extension so that the manager can identify the busiest period of the day, month, and year. This reporting system also includes the queue calls and also shows the internal calls with the ‘include internal calls’ option.
2. Ring Group Statistics: The ring group statistics also show the number of answered and received calls for one or various multiple ring groups. The statistics show the number of terms you add during report scheduling. The report also breaks this down by using the agent extension number so that you would know which agents are working and which need improvements.
3. Extension statistic report: This report helps to show the answered/ unanswered calls for different extension ranges. The stats also separate the inbound and outbound calls as well as the total combined calls. You can schedule reports, you can include the calls, or you can exclude the internal/external calls as per requirements.
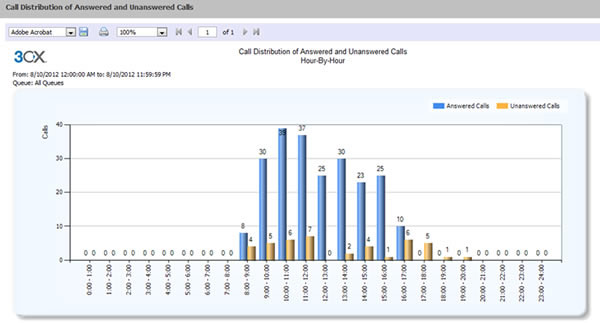
4. Call Distribution: The call distribution graph helps to display the calls made to and from the gateways, bridges, and trunks. The distribution includes the queue calls unless the ‘include Queue call’ option is not checked. The call distribution also reflects the calls that are made to the ring groups. It may also include internal calls if the ‘include internal calls’ option is checked.
5. Call Reports: A Call report shows the calls that are made as per the set parameters. You can add calls from a specific number, extension groups, and ranges. For instance, you want a report that shows calls from the internal extension or numbers with the (22), let’s say. You can choose the calls to specific numbers or can select the answered or unanswered calls as well as exclude the ringing time.
Part2: Quality of Service Reports
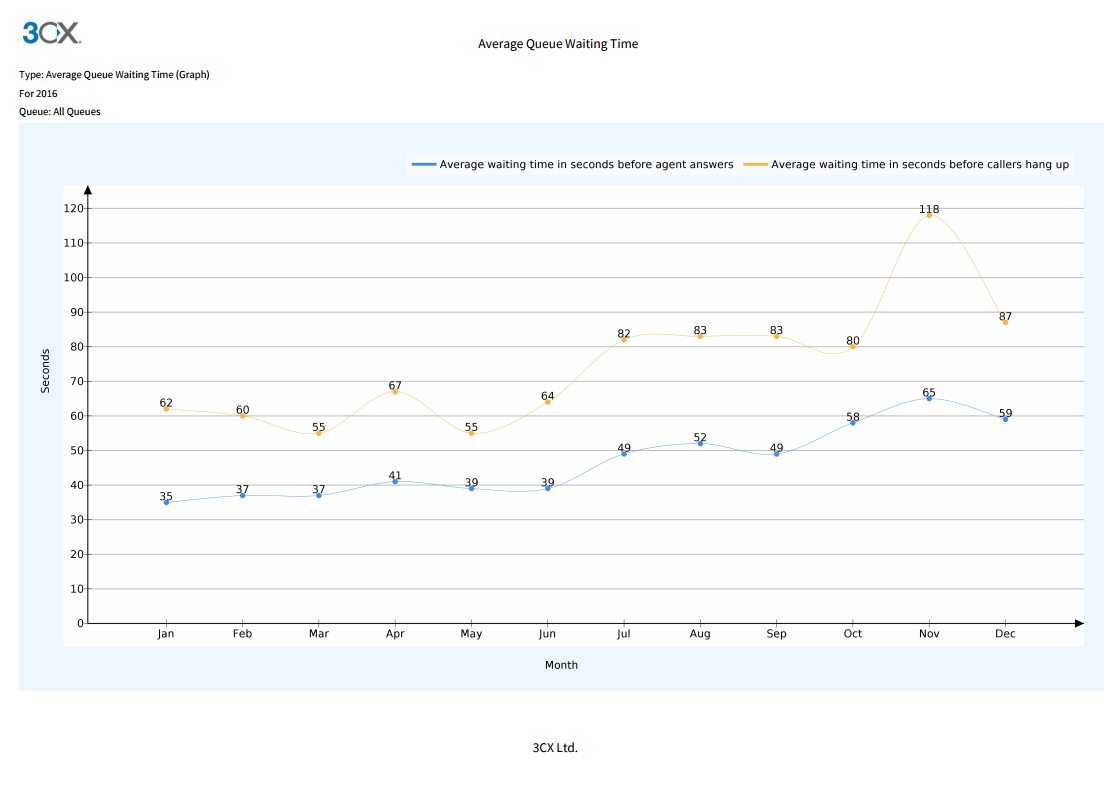
1. Average Queue Waiting time: The Average Queue waiting time is the frequency curve graph that shows the average wait time in seconds before someone answers. It also reflects the Average waiting time in seconds before the caller hangs up for a specific queue.
2. Call Cost by Extension Group: This report helps to summarize the cost of every call that is made by the extension groups. For this to show accurately, the call types should be configured properly so that the system can recognize local, national, mobile as well as international calls. The call cost should be configured for various destinations.
3. Call Cost by Call Type: This report is the same as that of ‘Call Cost by Extension Group,’ but instead of just grouping the extension group, these groups are defined by the call types like local, mobile, national, and international. The call types are configured properly so that the system can identify different calls, which should be configured for all destinations.
4. Queue Answered/Unanswered calls: This graph shows the progress and activity of ‘All Queues’ or “Individual Queues.” The graph also reflects the answered or unanswered calls made by agents that are in the queue.
5. Trunk DID: This report will tell how many calls you have received on your DIDs and on external numbers.
6. Queue Performance Overview: The queue performance overview summarizes the service level for one or various queues. The report will also show how many calls were received, serviced, and unserviced by the queue. The queue automatically breaks the statistics down by the agents so that clients can identify the best colleagues.
7. Statistics SLA: The SLA report will show the total number of calls that are received for one or various queues. It will also show you the number and percentage of those calls that are missed at the SLA. You also have the option to not add calls that are dropped before a specific time interval.
8. Detailed Queue Statistics: The detailed queue report will give you all the information that is required to access the performance. The queue statistics report includes:
- Calls: Answered, abandoned, total and % services
- Ring Time: The total and mean average
- Talk Time: The overall and mean average
- Callbacks: The number of successful callbacks
9. Breaches SLA: You can configure the SLA time, which is the acceptable waiting time for the customers calling your queues. This report will return how many calls are waiting in your queues apart from the configured SLA. The report will also highlight the overall time when the call is made, the caller ID, and the length of the time they were asked to wait before reaching the agent. You also have the option to exclude all the calls that were dropped before the specific amount of time.
10. Team Queue General Statistics: This report focuses on the performance of the queue at the team level rather than the extension level. The team queue also shows how many agents are in every queue and gives information on how calls are serviced when they are entered.
11. Queue Callbacks: The queue callback report will highlight the number of callers who request a callback before the agent services them. The report will also tell you how many calls the queue received, how many callbacks failed, and how many callbacks were made.
12. Team Queue Lost Calls: The team queue lost calls report focuses on how many calls entered a queue but were not answered by the agent. It gives a quick overview of how many calls went unanswered and helps queue managers get an idea of the total waiting time.
13. Queue Answered Calls by Wait Time: This report breaks the answered calls in a specific queue in a time in which they are waiting to be serviced by the agent. The report also highlights the call destination, caller ID, the ring time, and the answer time.
14. Queue Failed Callbacks: The failed callback report give more detail on the unsuccessful callbacks to improve the customer service for your clients. The failed callback report shows the time when the call was made, the queue it was called from, the ringing time, and the callback phone number.
15. Abandoned Queue Calls: This report shows the statistics that help managers identify the reason for the abandoned calls. The report also shows the waiting time, caller ID, the number of people polling attempts, the agent who received the call, and the state of mind of the people at the time of the call.
16. Agent Login History: The agent login history shows the queue manager how often their agents are logging in the call. This can highlight the agents who are not performing. The report also indicates the time agents log in and out of the queue. You can see the total time the agent has spent logged in by day and their total talk time.
17. Agents in Queue Statistics: In the agent in queue statistics report, you will see the total time logged in, the number of calls answered, % served, and number answered per hour. This report also includes the ring time and talks time, along with the mean average.